|
February 2005, Volume 27, No. 2
|
Discussion Papers
|
|
An appraisal of the calibrated Framingham equation for Chinese and its application - Part II
W K Lam 林永 HK Pract 2005;27:68-74 Summary Based on the format of the New Zealand risk charts, we developed a set of coloured risk charts and a computer programme for the Chinese cohort using the Chinese Multi-provincial Cohort Study (CMCS) equation. Although there is reservation on whether and to what extent the CMCS calibrated equation could be applied to Hong Kong residents, we believe it is better than the Framingham equation in the prediction of cardiovascular risk for Hong Kong Chinese. The accuracy of the chart is limited by the validity of applying the CMCS calibrated equation to the Hong Kong population. There are no data to show whether and to what extent the CMCS calibrated equation could be applied to Hong Kong residents. Our charts and computer programme provide additional references for cardiovascular risk assessment in Chinese patients. 摘要 依照紐西蘭風險圖表模式,我們利用中國多省市人口組別研究(CMCS)的方程式製作了一套適用於華人的風險彩圖及電腦程式。 雖然方程式對港人的適用程度還未確定,我們相信它會比費明咸方程式更能準確地預計港人心血管病的風險。 圖表的準確程度受制於在應用中國多省市人口組別研究經標定後方程式於港人時的有效性。現時尚未有數據表明其適用程度。 我們的圖表及電腦程式為評估華人心血管疾病的風險提供了多一項參考。 Introduction In part I of our paper, we appraised the Chinese Multi-provincial Cohort Study (CMCS).1 In part II, we proceed to the fourth step of evidence-based medicine: the application of evidence. Although there is reservation on whether and to what extent the CMCS calibrated equation could be applied to Hong Kong residents, we believe it is better than the Framingham equation in the prediction of cardiovascular risk for Hong Kong Chinese. Our aim is to facilitate the convenient use of the CMCS equations for local doctors. This paper describes the process and the end products of our attempt in the development of risk assessment tools, which may serve as references for our colleagues in clinical decision making and during discussion with patients. Tools for assessing absolute risk of coronary heart disease and cardiovascular disease Different tools are available for the estimation of a patient's absolute risk of coronary heart disease (CHD) or cardiovascular disease (CVD), all based on the Framingham equation. They are in the form of charts/tables /computer softwares and estimate the 10-year or 5-year risks of different clinical outcomes (Table 1). The risk factors used in the assessment include age, sex, smoking status, total cholesterol (TC), High Density Lipoprotein (HDL) cholesterol, Low Density Lipoprotein (LDL) cholesterol, left ventricular hypertrophy, blood pressure (BP) and diabetes mellitus. The charts (or tables) are of two types. One type assigns scores to individual risk factors and gives an estimated risk level from the total score (e.g., Categorical Framingham tables).2 The second type translates the clinical information in columns and rows either to give a risk alone (e.g., New Zealand tables) or to provide additional guide on treatment decisions (e.g., Sheffield tables).2 Charts are easier to use in the clinical setting because they do not need computers or special equipments. However, charts only give an estimation of the risk in the form of a range of values, predefined threshold or approximations. On the other hand, computer programmes are more precise as they give finer gradation of values, based on the formulae derived from individual studies. The CMCS calibrated equations The Framingham investigators used the Cox regression model to predict absolute risk of CHD.3 The regression model involves three components: the prevalence, the mean value of a risk factor in the population and the regression coefficient of that factor against the occurrence rate of the end-event. Among the Chinese population, the prevalence of various risk factors and the incidences of CHD and stroke are very different from the Framingham population. Hence CMCS investigators recalibrated the original Framingham equation to predict the absolute risks of ischaemic cardiovascular disease (iCVS), which stands for the combined CHD and ischaemic stroke event rates.5
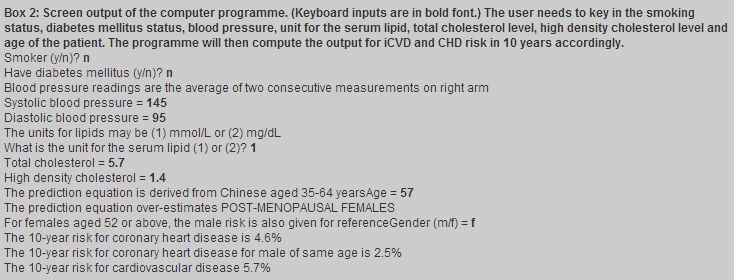
Risk prediction chart from CMCS equations to estimate ischaemic cardiovascular disease ischaemic cardiovascular disease (combined CHD and ischaemic stroke, iCVD) Based on the format of the New Zealand risk charts,4 we developed a set of coloured risk charts for the Chinese cohort. The format of the New Zealand charts was adopted because it is more direct to convert the values calculated from the calibrated CMCS equation into discrete numbers (colored squares). This format has also been considered by a systematic review to be more accurate, easier to use and preferred by frontline practitioners.2 Three charts have been developed for three different categories of HDL levels (<1.04 mmol/L, 1.04-1.55 mmol/L and >1.55mmol/L) to estimate iCVD. These are different from the British, European or New Zealand charts that use "TC to HDL ratio". We use three tables instead of one because in the CMCS regression equation, TC and HDL are independent predictors3,5 and thus have to be grouped into several categories (e.g., HDL into <1.02mmol/L, 1.02-1.55mmol/L and >1.55mmol/L) before being entered into the regression model. We did attempt to construct a simpler chart, using TC/HDL ratio instead of the three categories of HDL. We tried to use the highest level of TC and HDL in each HDL category to compute the TC/HDL ratio. However, the computed risks were haphazard both within the same grade and among different grades of hypertension. We conclude that the best way to construct a chart using TC/HDL ratio is another equation from the raw data. Using the charts The charts in Appendix 1 only apply to primary prevention of iCVD in Chinese in the age range of 35-64. First select the chart according to the patient's HDL level. Choose the chart section corresponding to the person's sex, diabetic status, smoking status, and age. ("Age 50" in a chart indicates the age range of 45-55 years.) Find the cell nearest to the person's blood pressure (the average of two measurements on the right arm) and value of total cholesterol. When systolic and diastolic blood pressures fall in different categories, the higher category applies. Compare the colour of the cell with the risk level colour key and read the predicted ten-year risk of iCVD. For example, to estimate the 10 year iCVD risk of a 49-year old male diabetic patient who is a smoker with TC 5.2 mmol/L, HDL 1.0 mmol/L and BP 120/90 mmHg, the chart would give a colour key corresponding to a 10-15% risk level for fatal and nonfatal cardiovascular event (including heart attack and stroke) over 10 years. Computer software We also developed a Windows based computer programme for a more precise calculation of the absolute risks. A user can simply key in the appropriate smoking status, age, sex, total cholesterol, HDL cholesterol, unit used for measurement of cholesterol and blood pressure of the patient. The computer programme will subsequently compute the absolute risk for iCVD and CHD separately. A version for use in a personal digital assistant (PDA) is also available. Box 2 illustrates an output of the programme. Discussion Both tools developed by the authors would be more applicable to residents in Mainland China, the population from which the calibrated equations were derived. These tools could help Hong Kong doctors to discuss the combined effect of several risk factors with their patients. The accuracy of the tools is limited by the validity of applying the CMCS calibrated equation to the Hong Kong population, which could well have different risk levels compared to the CMCS population. Moreover, the classification of hypertension and definition of diabetes mellitus used in the CMCS Study are different from the current accepted convention in Hong Kong.1 Several unexpected findings are unearthed when the CMCS equation is used for risk calculation. The first is that for women, non-smokers have higher predicted risks for CHD than smokers. This may be due to the low smoking rate and few CHD events, resulting in falsely low estimates of the effect of smoking.3 Secondly, for women with blood pressure in the range 140-159/90-99 mmHg and 160-179/100-109 mmHg, individuals with lower blood pressure have higher risks than those with higher blood pressure. This may also be due to the relatively low incidence rates for iCVD in women. Clinicians should be aware of these unexpected findings while using these tools. Our tools only provide a guide to the risk assessment of iCVD, and clinicians should apply their professional judgment with each patient. The predicted risk is an estimated mean value for the "typical" or "average" sample of a population and individuals do vary from the mean value. Moreover, a "10% risk in five years" might just be a figure with not much meaning to a patient, or with different meanings to different patients.6 The presentation of the absolute risk, relative risk or number needed to treat could affect an individual's judgment of his own risk.7 Plain words in addition to mathematical figures often convey the message better, and personal experience as well as core belief affect an individual's interpretation of risk.8 How to use an assessment tool in risk communication with patients is outside the scope of this paper.
Key messages
W K Lam, MBBS(HK), DFM(CUHK), PDipCommunityGeriatrics(HK)
Senior Medical Officer, L C Y Tsang, MBBS(NSW), DFM(CUHK), FRACGP, FHKAM(Fam Med) Consultant Family Physician, Professional Development and Quality Assurance, Department of Health. Y T Wun, MBBS(HK), MPhil, MD, FHKAM(Fam Med) Research Committee, The Hong Kong College of Family Physicians. A K L Chan, MBBS(HK), DFM(CUHK), FHKCFP, FRACGP Family Physician in Private Practice. The Hong Kong Medical Association. Correspondence to : Dr W K Lam, 1/F Main Block, Pamela Youde Nethersole Eastern Hospital, Chai Wan Family Clinic, Chai Wan, Hong Kong.
References
|
||