December 2010, Volume 32, No. 4 |
Letters to the Editor
|
||
|
HK Pract 2010;32:156-158 Dear Sir, Faulty nomograms of peak expiratory flow rates (PEFR) for Hong Kong ChineseChan SH et al has constructed nomograms of peak expiratory flow rates (PEFR) for Hong Kong Chinese covering a wide age range of 5 to 70. However there are 3 serious mistakes in this paper.1
References
Authors’ reply Dear Editor, Nomograms need to be updatedWe thank very much the comments from Drs Fung and Lau. It is good that readers of the Journal critically appraised our article. We always welcome comments with an open and unpretentious mind. Fung & Lau are obviously very interested in the children’s part of our study and make references to their co-authored studies on Hong Kong children published in 1985, 25 years earlier. We share the same interest in children. Although we have recruited 1194 participants aged 5-20 years in our sample, we do not think this sample size is large enough to derive separate formulae for predicting the PEFR of normal children. (With the sample size of 1200, the margin of error, or confidence interval, is ±3% at the 95% confidence level. For a ±2% margin of error, the estimated sample size is 2400.) It was our initial plan to recruit more school children in 2009-2010 for this purpose. Unfortunately the outbreak of H1N1 epidemic in 2009 deterred us from assembling students to blow into the same peak flow meters. We shall continue this part of our survey and try to establish separate nomograms for children in the very near future. “Eye-balling” the scatterplot of PEFR against age, one might divide our sample population into three groups: children up to age around 20, young adults up to age around 43, and the middle-aged adults up to 65 years. (The word “around” denotes the complicated fuzzy logic in determining the appropriate cut-points, instead of from eye-balling.) As the primary aim of the study is to survey people aged 5-65, the data should be presented as a whole. Moreover, the sample size would need to be about doubled if the three different groups are to be individually analyzed with good statistical power. The research team had lengthy discussion on the most suitable way to summarize the whole sample: linear regression or quadratic regression. Either way has its own drawbacks (Fung & Lau have pointed out one drawback for the quadratic equation in their letter). We choose the quadratic regression due to the better coefficient of determination (R2), in spite of the limitations (like a photographer using a wide-angle lens for a panoramic image and accepting the distorted depth perception). Fung & Lau comment that “age and height are collinear” for children. This statement is not true for our sample. When we regress (linearly) the PEFR by age and height of our participants aged 5-20 with inclusion of collinearity statistics, the tolerance was 0.421 for both age and height, and the variance inflation factor (VIF) was 2.313. The statistics show that the age and height for our sample are unlikely to be collinear. It is not appropriate to use age alone for regression analysis; there will be further explanation later in this letter. We are grateful to Fung & Lau’s sharp observation on the unexpected notches in the PEFR curves for boys aged 5-6. We checked the charts in the spreadsheets that we used for the nomograms and discovered a technical error in formatting the chart. This was rectified and the notches were smoothed out.
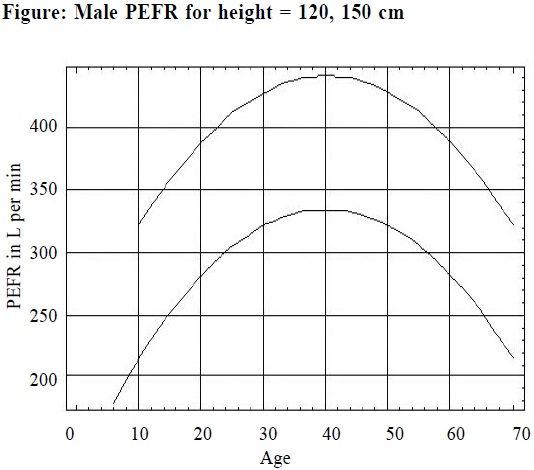
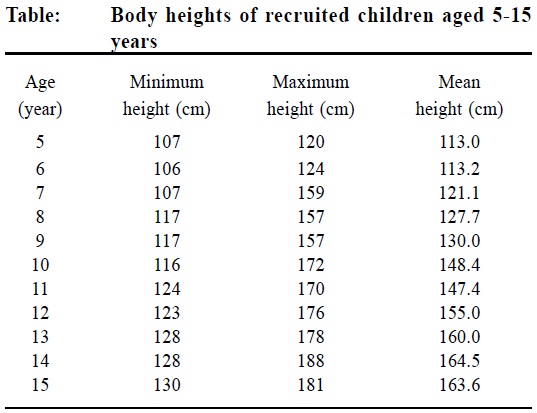
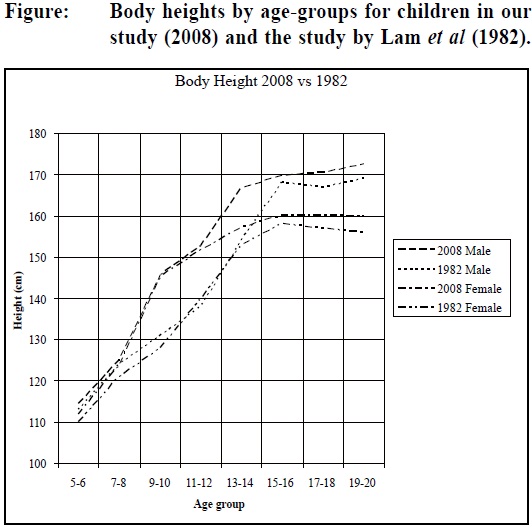
As to the choice of body heights for the nomograms, we would like to refer our readers to the attached Table. For brevity, we present only the participants aged 5-15 and do not separate them into male or female sex. From the Table, the body height of 140 cm will cover the range of participants aged 7-65 and this is our reason to choose 140 cm as the starting curve. If 135 cm is used, the curve will start at age 7 and end at 15; for 130 cm, the respective ages are 5 and 10. These two curves are too short to represent the whole sample. However, we should have been more careful with the curves of 165-180 cm. The 165 cm and 170 cm curves should start at age 10; the 175 cm at age 12, and 180 cm at age 14. We must apologize to our readers for this. The Table also shows that 150 cm is very close to the mean height for our participants aged 10, contrary to the 97th percentile quoted by Fung & Lau from their study 25 years ago. Fung & Lau certainly agree that there are secular changes in body heights of children in Hong Kong. We have compared our findings with the study published by Lam et al in 19821 for the local residents. When we chart the body heights against the age-groups in years (Lam et al present the age of participants in groups of 2 years) for children up to 20 years, we note significant differences between the two studies in body heights (up to 10 cm) for some children. The attached Figure shows that for children in our study there is a steep rise in body height at around age 9. This steep rise in height could explain why age and height are not collinear for our sample. It also shows that the local children’s heights have changed over the past 25 years. Clinicians should be careful when referring to older charts for children’s heights.
It is the time to update also the nomograms of body heights for children in Hong Kong. We would like to thank the Journal for giving us the opportunity to explain more to her readers about our study. We shall continue to update and revise the nomograms. We would also like to note a corrigendum that there is a typo for Figure 2 in our published paper. The X-axis should be labeled “Age” instead of “Height”.
Reference
|
|||