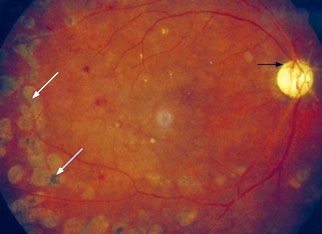
Figure 15: Regression of NVD (black arrow) in PDR after retinal laser treatment (white arrows)