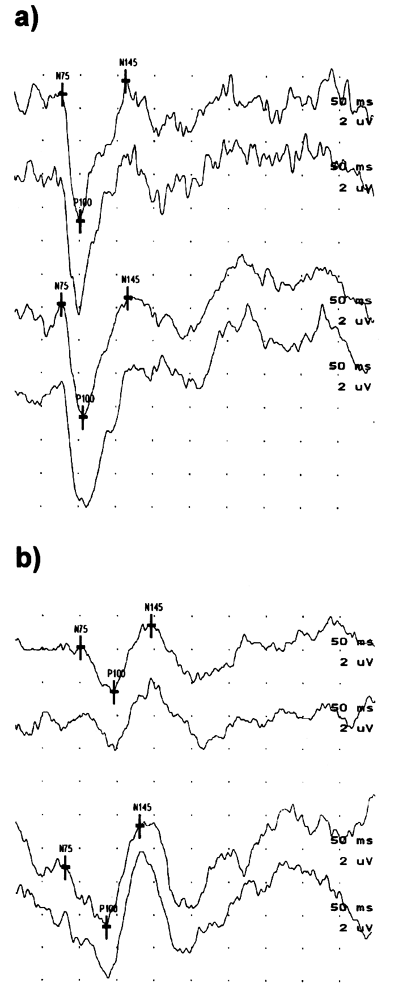
Figure 3: a) Normal visual evoked potentials. b) Visual evoked potentials in a patient with multiple sclerosis and bilateral optic neuritis showing delayed onset of P100 responses in both eyes. (Each division in the horizontal axis represents 50 msec)
