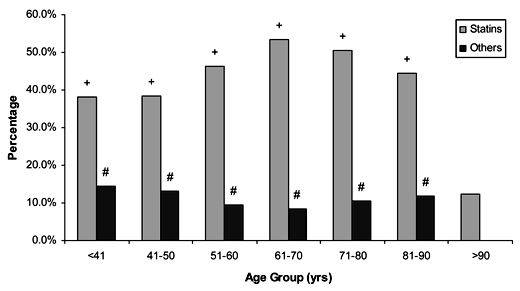
Figure 3: Age distribution amongst the subgroups receiving drug therapy