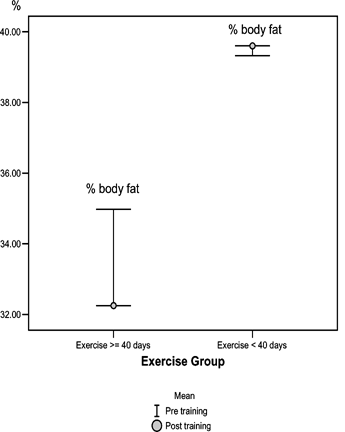
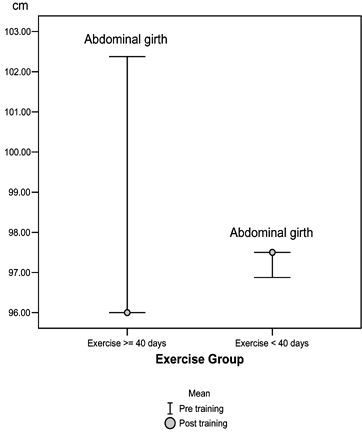
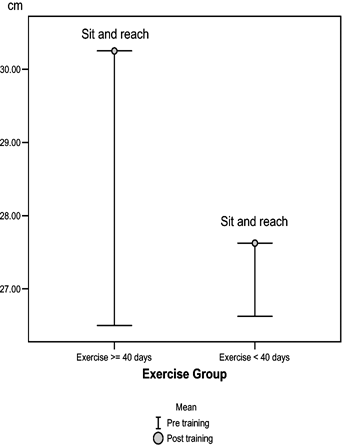
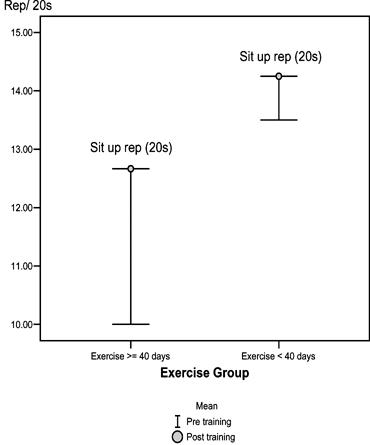
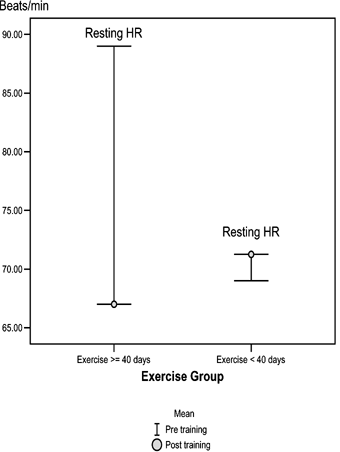
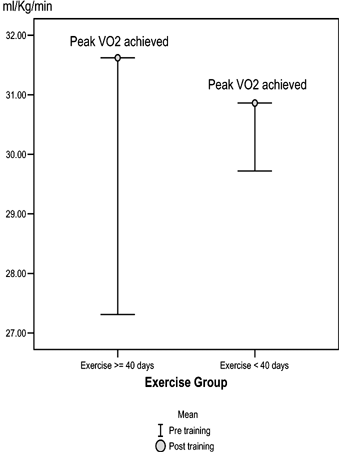
| Figure 3: A comparison of the variable changes between subjects who exercised more, or less, than 40 days. a) percentage of body fat, b) abdominal girth c) sit and reach distance, d) number of sit ups in 20 seconds, e) resting heart rate, f) peak oxygen consumption during exercise test | |||||||||||||||||||||||||
|
