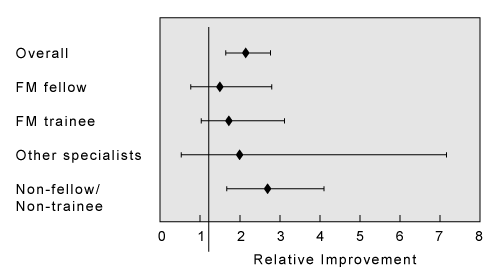
Figure 1: Relative change in number of P1/P2 appointments after intervention. Error bars indicate 95% confidence intervals