
|
March 2026,Volume 48, No.1
|
Original Article
|
||||||||||||||||||||||||||||||||||||||||||||||||||||||||||||||||||||||||||||||||||||||||||||||||||||||||||||||||||||||||||||||||||||||||||||||||||||||||||||||||||||||||||||||||||||||||||||||||||||||||||||||||||||||||||||||||||||||||||||||||||||||||||||||||||||||||||||||||||||||||||||||||||||||||||||||
Assessing self-perceived and calculated osteoporotic fracture risk among postmenopausal women in two family medicine clinics in Hong KongEsther SC Pang 彭詩情, Hua-li Wang 王華力, Wai-kit Ko 高煒杰, Siu-kei Kwong 鄺兆基 HK Pract 2026;48:3-14
AbstractObjective: We aimed to compare the participants’ self-perceived fracture risk (SPR) with fracture risk calculated by the Fracture Risk Assessment Tool (FRAX) and to identify factors associated with the underestimation of calculated risk.Design: This is a cross-sectional study using questionnaires. Subjects and main outcome measures: We collected demographic data and health information from postmenopausal Chinese women aged 50 to 90 through convenience sampling at two government-funded family medicine clinics (FMC) in Hong Kong. The participants estimated their 10-year osteoporotic fracture risk as low (0-9%), moderate (10-19%) or high (≥ 20%), as referencing from previous studies. Their SPR was analysed with their calculated risk. Results: In this study, we recruited 352 participants (age 67.5 ± 9.1 years). The proportion of fragility fracture and osteoporosis was 16% and 9%, respectively. Among those aged 65 or above, 66% had not undergone Dual-energy X-ray absorptiometry (DXA) scanning. 59% of the participants had low calculated fracture risk, while 27% and 14% had moderate and high calculated risk. Notably, 56% of high-risk participants underestimated their calculated risk. In our multivariate logistic regression model, we found that underestimation of fracture risk was statistically significantly associated with higher age (Odd ratio (OR)1.19, 95% Confidence Interval (CI): 1.12-1.26, p<0.001) and lower body mass index (BMI) (OR 0.78, 95%CI: 0.63-0.95, p=0.02). Conclusions: Women with high calculated fracture risk tend to underestimate their risk, particularly those with higher age and lower BMI. Most at-risk individuals never had a DXA scan. Keywords: osteoporosis, self-perceived risk, fracture, FRAX, primary care
摘要目標:本研究旨在比較參與者自我感知的骨折風險(SPR) 與骨折風險評估工具(FRAX)計算的骨折風險,從而確認 低估計算風險的相關因素。設計:採用問卷形式的橫斷面研究。 對象及主要結果測量:本研究透過任意抽樣,在香港兩所 政府資助的普通科門診(FMC)收集50至90歲停經後中國女 性的人口統計和健康資訊。根據先前研究,參與者將自身 10年骨質疏鬆性骨折風險估算為低風險(0-9%)、中度風險 (10-19%)或高風險(≥ 20%)。以她們的計算風險結合分析 其SPR。 結果:本研究共招募了352位參與者(年齡67.5 ± 9.1歲)。 脆性骨折和骨質疏鬆症的比例分別為16%和9%。在65歲或 以上的參與者中,66%未接受過雙能量X射線骨密度檢測 (DXA),59%參與者的計算骨折風險低,而27%和14%的參 與者分別有中等和高的計算風險。值得注意的是,56%的 高風險參與者低估了自身的計算骨折風險。在我們的多元 邏輯迴歸模型中,我們發現低估骨折風險與較高齡(勝算比 (OR)1.19,95%信賴區間(CI):1.12-1.26,p值< 0.001)和體 重指標(BMI)較低(OR=重指標(BMI)較低(OR 0.78,95%CI:0.63-0.95,p值=0.02)有統計學上的顯著相關性。 結論:計算骨折風險高的女性往往會低估自身風險,尤其 是年齡較大和體重指標較低者。大多數高危者從未接受過 雙能量X射線骨密度檢測。 關鍵詞:骨質疏鬆症、自我感知風險、骨折、FRAX、基層 醫療 IntroductionOsteoporosis is a common yet preventable medical condition that increases susceptibility to fragility fractures. The elderly, especially women are at the highest risk of developing osteoporosis. Among all fragility fractures, hip fracture is associated with the highest morbidity and mortality rate.1 Previous studies showed that the 1-year mortality rate after hip fracture was estimated to be around 20%.2 With the highest life expectancy globally, Hong Kong was predicted to be one of the regions with the highest increase in the incidence of hip fractures by 2050.3 The aging population would impose significant implications on the healthcare burden. Despite its significance, osteoporosis remains underdiagnosed and undertreated in Hong Kong. Patients are often diagnosed with osteoporosis only after they have had fragility fractures.4 Currently, there is no government-led osteoporosis screening program in Hong Kong. Local experts had proposed that a universal osteoporosis screening program was cost-effective to reduce fragility fractures. Every man aged ≥70 years and woman aged ≥65 years was recommended to have Dual-energy X-ray absorptiometry (DXA) scan screening.5,6 However, no public funding is available to support the screening. The cost of a private DXA scanning session was estimated to be around HK$500 in 2018.5 According to the health belief model, individuals' risk perception can affect their health-related behaviours.7 Studies showed that individuals with higher perceived fracture risk were more likely to adopt bone-protective behaviours, such as undergoing DXA scans and taking anti-osteoporotic medications.8,9 Nevertheless, existing evidence dominated by Western countries found that at-risk individuals were often less aware of their fracture risk compared to individuals who were not at risk. Individuals with risk factors for osteoporotic fractures often underestimate their actual fracture risk.10-12 Whether the at-risk population in an Asian context, such as Hong Kong, has lower awareness of their fracture risk remains unknown. Hence, this study aimed to assess the relationship between fracture risk perception and calculated fracture risk among postmenopausal women in Hong Kong. The primary objective was to evaluate the discrepancy between the participants' self-perceived fracture risk and the fracture risk calculated by FRAX. The secondary objective was to identify specific risk factors that contributed to the underestimation of fracture risk. Given that consultation time in family medicine clinics (FMC) is limited, identifying at-risk groups will enable family physicians to provide targeted interventions. MethodologyStudy DesignThis is a cross-sectional study approved by the Institutional Review Board of the University of Hong Kong/Hospital Authority Hong Kong West Cluster (Reference number: UW 22-760). We recruited postmenopausal women who attended the two government-funded family medicine clinics in Southern District from 3 January to 28 April 2023. Our study focused on postmenopausal women as they were more prone to have osteoporosis than men of the same age. Although the local recommendations promoted universal screening of osteoporosis in women from age 65; women aged below 65 and with risk factors of osteoporosis were also recommended to have screening.6 Therefore, we recruited women aged between 50 to 90. Convenience sampling was used to recruit the subjects. Exclusion criteria for this study were: (1) women who had menstruated within the past year, (2) individuals of non-Chinese ethnicity, (3) women who were unable to understand Chinese, (4) individuals with mental incompetence, and (5) those who refused to participate in the study. Sample sizeBased on data from an international study and an American study, the estimated proportion of individuals with inaccurate fracture risk estimation was 30%.10, 11 To achieve an absolute error of 5% and a type 1 error of 5% (p<0.05), we calculated a sample size of 323 using the following sample size formula.13 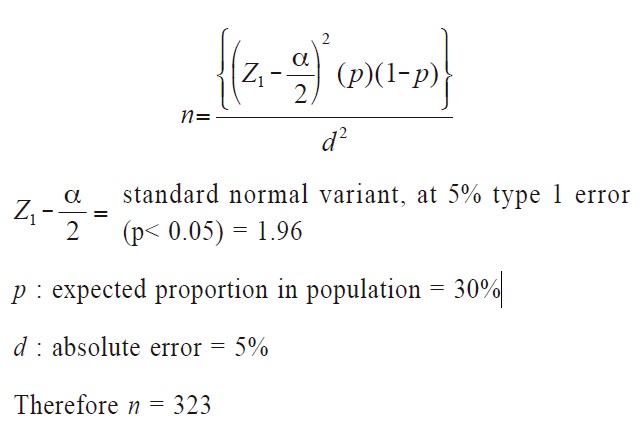
FRAX is a fracture risk prediction tool developed by the World Health Organization.14 We selected FRAX to predict the fracture risk for participants in our study because it was a validated tool and a Hong Kong-specific FRAX algorithm was available. The Hong Kong algorithm was developed using data from postmenopausal women aged 50 years or older.15 Moreover, the Hong Kong-specific FRAX calculator can be easily accessed online. To generate the 10-year major osteoporotic fracture risk and hip fracture risk, an individual's age, body weight, height, gender, and seven risk factors were entered into the algorithm. The fracture risk can be generated with or without the bone mineral density. FRAX without bone mineral density, is also recognised as a well-validated instrument.16 Figure 1: Flow Chart for data collection (The figure was amended)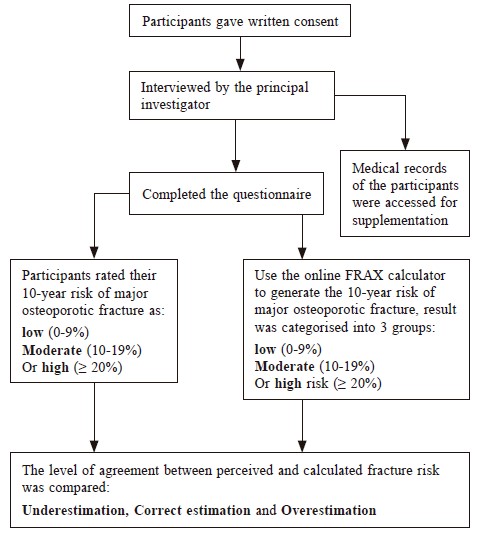
Data collectionAfter written informed consent was obtained, the principal investigator interviewed the participants and completed the questionnaire (Appendix 1). Figure 1 summarises the workflow of data collection. The questionnaire consisted of three parts: (1) Demographic profiles of participants were assessed, including age, weight, height, marital status, education, occupation, and monthly household income. The health practices of the participants were assessed by obtaining information on their smoking habits, physical activities, daily sun exposure, and the use of daily calcium and vitamin D supplements. When inquiring about daily dietary calcium intake, a pamphlet was shown to the participants to help them estimate their daily dietary calcium intake. This pamphlet was designed by The Chinese University of Hong Kong Jockey Club Centre for Osteoporosis Care and Control.17 (2) Risk factors associated with osteoporotic fractures were evaluated using six items adapted from the FRAX. These items included a personal history of fragility fracture, parental hip fracture, current or previous use of oral glucocorticoids (at a dose of ≥ Prednisolone 5mg daily or equivalent doses of other glucocorticoids for more than three months), excessive alcohol consumption (3 or more units of alcohol daily), received previous DXA scan, and prior diagnosis of osteoporosis.18 The level of alcohol consumption was determined using the local online alcohol unit calculator.19 If the participant could not provide an answer to the question, a negative response was assumed.3) The participants rated their perceived 10-year risk of a major osteoporotic fracture as low risk (0-9%), moderate risk (10-19%), or high risk (≥20%). Calculation of fracture risk by FRAXThe medical records of the participants were reviewed to confirm if they had previous DXA scans, received a diagnosis of osteoporosis, and with conditions related to secondary osteoporosis (including type I Diabetes Mellitus (DM), long-standing untreated hyperthyroidism, premature menopause (<45 years), chronic malabsorption, chronic liver disease).18 With the information obtained from the questionnaires and the medical records, we used the online FRAX Hong Kong calculator (version 4) to calculate the 10-year risk of a major osteoporotic fracture for each participant.18 As not all of the participants had DXA scanning before, bone mineral density measurement was not included in the risk calculation. The calculated fracture risks were categorised into low (0-9%), moderate (10-19%), and high risk (≥20%). This risk categorisation was also used in previous studies.11, 20 It was created in a similar approach to the Framingham Risk Scoring.21 In addition, this risk categorisation was also used in the guidelines for osteoporosis screening in Taiwan.22 The Hong Kong Reference Framework published in 2022 also suggested that individuals with 10-year major osteoporotic fracture risk ≥20% were at high risk and they should receive pharmacological treatment for osteoporosis.6 In our study, we only assess the perceived 10-year major osteoporotic fracture risk but not the hip fracture risk for two reasons. Firstly, previous research found it challenging for participants to differentiate between osteoporotic fracture and hip fracture.20 Secondly, a population study suggested that for individuals with current or previous osteoporosis treatment, their hip fracture risk may be overestimated by FRAX.23 Appendix 1: Questionnaire 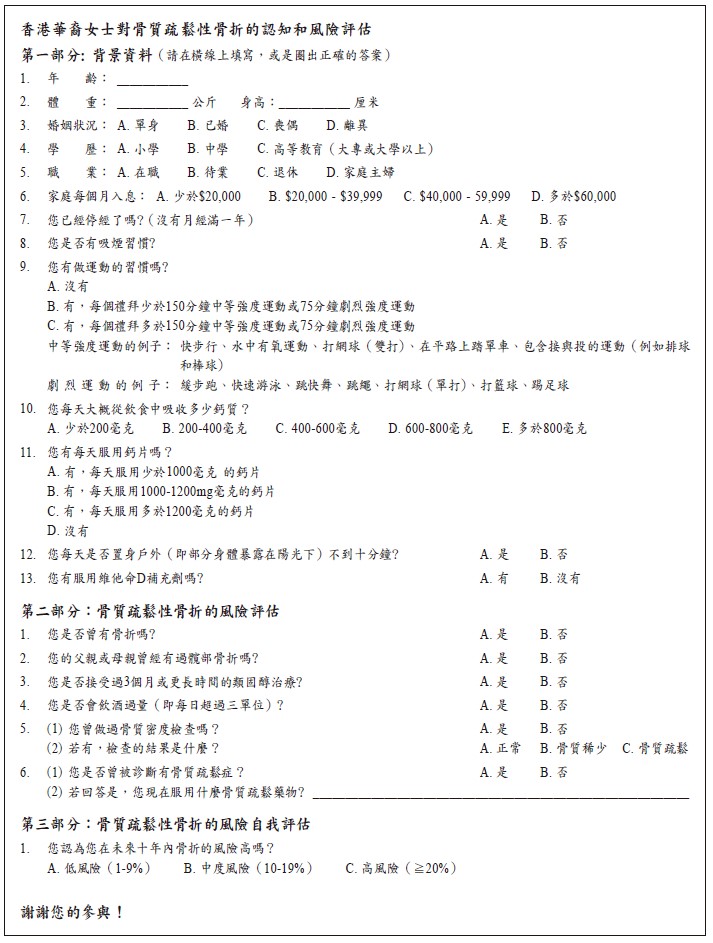
After comparing the calculated fracture risk with the self-perceived fracture risk of the participant, three levels of agreement were determined: underestimation, correct estimation, and overestimation. The results were then explained to the participants, and at-risk participants were advised to have a DXA scan for osteoporosis screening. Data analysisWe used the R software (version 4.2.1) to analyse the data. Descriptive statistics were used to evaluate the discrepancy between the self-perceived and calculated fracture risk. Percentages of underestimation, correct estimation, and overestimation were calculated. The association between the self-perceived and calculated fracture risk was assessed by using Spearman's rank correlation. Wilcox-on rank sum test, Pearson's Chi-squared test, and Fisher's exact test were used to analyse the association between different factors and underestimation of calculated fracture risk. Parameters with p-value <0.05 were input to a multivariate logistic regression model. Odds ratios were calculated, and results with a p-value of <0.05 were considered statistically significant. ResultsA total of 352 participants were enrolled in this study, with 303 recruited from Clinic A and 49 from Clinic B. Clinic A and B were from the same district and demographic characteristics were comparable. The participant characteristics are presented in Table 1. On average, the participants were 67.5 ± 9.1 years old, with a mean BMI of 24.8 kg/m² (SD = 4.2, range = 14.6-39.7). The majority of subjects were married, retired, and completed secondary education. Most subjects reported a monthly household income below $20,000. Regarding health practices, this study found that 60% of the participants engaged in regular weekly exercise, while 55% had daily sun exposure of more than 10 minutes. Many of the participants struggled with questions related to daily dietary calcium intake and calcium supplementation use. Therefore, the data concerning dietary calcium use was not included in the data analysis. Instead of assessing the dosage of the calcium supplement, whether the calcium supplement was used was assessed (Table 1). A significant proportion of the participants did not take bone-protective supplements. Specifically, 70% did not consume daily calcium supplements, and 77% did not take daily vitamin D supplements. In terms of risk factors for osteoporosis, 16% of the participants had a previous fragility fracture, and 7% reported a parental history of hip fracture. Moreover, 2% of the participants had a history of rheumatoid arthritis or prolonged use of glucocorticoids. Very few had a history of secondary osteoporosis (0.5%). A small proportion of the total participants were smokers (2%) or heavy drinkers (0.28%). Our study found that a significant proportion of participants had never undergone a DXA scan previously. Out of the 352 participants, 71% had not received a prior DXA scan. Among participants aged 65 or above, 66% had not undergone DXA scanning. For participants aged below 65 and had moderate to high FRAX risk, 50% of them did not have DXA scanning. The local guidelines recommend that all patients with a history of fragility fracture should undergo DXA scan screening.15 However, in our study, 53% of the participants with a history of fragility fracture had not undergone a DXA scan. The above findings are summarised in Table 2. Table 1: Characteristics of the participants as a whole and stratified by level of agreement between the self-perceived and calculated fracture risk
¹Data are described as: mean (SD) [range]; ²Data are described as n (%) *Wilcoxon rank sum test; ^Pearson’s Chi-squared test; † Fisher’s exact test Table 2: Proportion of at-risk subjects with and without prior DXA scanning
Table 3: Proportion of osteoporosis and with DXA scanning utilisation by age group
Table 4: The agreement between the self-perceived and calculated fracture risk of the 352 study par-ticipants
Table 5: Results of multivariate logistic regression analysis for factors associated with underestima-tion (n=352)
Among the 102 participants who had undergone DXA scanning previously, 30 (29.4%) were diagnosed with osteoporosis, and 35 (34.3%) were diagnosed with osteopenia. Overall, this study revealed that the proportion of osteoporosis was 9%. Among those who had osteoporosis, 87.9% were aged 65 or above (Table 3, (29/33 = 87.9%). Agreement between perceived and calculated fracture riskWe used the FRAX algorithm to calculate the ten-year risk of a major osteoporotic fracture for all participants. The mean calculated fracture risk was 10.1% (SD=7.47, range=1-40%). Most participants (59%) had a low calculated fracture risk, while 27% and 14% had moderate and high calculated fracture risk, respectively. Regarding self-perceived fracture risk, 19% of participants rated themselves as low risk, 58% as moderate risk, and 23% as high risk (Table 4). Comparing the self-perceived and calculated fracture risk, we found that 55% of the total participants overestimated their fracture risk, 33% estimated it correctly, and 13% underestimated it. The agreement between self-perceived and calculated fracture risk i s summarised in Table 4. Alarmingly, 56% of the participants with high calculated fracture risk underestimated their fracture risk. The factors associated with underestimation of fracture risk are presented in Table 1. The bivariate analysis showed that participants who underestimated their fracture risk were at an older age (p<0.001), with a lower body weight (p=0.014) and a lower BMI (p=0.034). This is consistent with results in our multivariate logistic regression. Table 5 showed that for every year of increase in age, the participant is 1.19 times more likely to underestimate their calculated fracture risk (p<0.001). Similarly, participants with every decrease in BMI score are 78% as likely to underestimate their self-perceived risk compared to their calculated risk (p=0.02). Participants with daily calcium supplement use (p=0.028) and had prior DXA scans (p=0.036) were less likely to underestimate their fracture risk, although not statistically significant in the multivariate logistic regression model. Lastly, we also found that Spearman’s rank correlation between perceived and calculated fracture risk was very weak (r=0.165, p=0.0019). DiscussionWe compared the self-perceived and calculated fracture risk of the participants and observed that there was a substantial discrepancy between them. The correlation between the perceived and calculated fracture risk was weak, supporting the findings of previous studies.20, 24 Compared to the overestimation of fracture risk, underestimating the fracture risk may lead to more severe health outcomes. Individuals who underestimate their fracture risk are less likely to engage in screening and bone-protective health behaviours. Subsequently, this could lead to an increasing incidence of fragility fractures. Therefore, this study specifically examined the subgroup of participants who underestimated their fracture risk. Comparison with previous studiesMore than half of the women with high calculated fracture risk underestimated their fracture risk in our study. Similar findings were reported in previous studies.10-12 The Global Longitudinal Study of Osteoporosis in Women (GLOW), an international cohort study involving 60,393 postmenopausal women, revealed that the majority of women with risk factors did not recognise their actual fracture risk.10 Similarly, an American study by Grover et al. found that participants in intermediate and high FRAX risk categories also underestimated their fracture risk.11 In Brazil, a study showed that 79.3% of women classified as high-risk by the FRAX algorithm underestimated their risk of fractures.12 There were limited studies conducted in Asia to assess the fracture risk perception of women. A Japanese study conducted from 2008 to 2011, with a total of 16,801 women aged 50 or above, showed that most of the at-risk individuals did not recognise their risk of osteoporosis.25 Worldwide studies consistently showed that most of the at-risk individuals underestimated their fracture risk. Our study showed that women who were older or with a lower BMI were more likely to underestimate their fracture risk. Previous studies also demonstrated that the elderly were prone to underestimating their fracture risk.11, 12, 20 In a Hungarian study, which focused on assessing the perceived fracture risk in osteoporotic women, they found that women with higher BMI tended to underestimate their fracture risk.20 This was different from our findings. Older age and low BMI were known risk factors for osteoporosis, yet most participants with these risk factors failed to recognise them in our study. A local observational study involving 1,800 women aged 65 years or above, conducted by Lo SS et al. from 2017 to 2020, demonstrated that low BMI was significantly associated with osteoporosis (OR 6.194; 95% CI, 3.746-10.252; p<0.001). Their study also showed that osteoporosis was more prevalent in elder women. For women aged from 65 to 69, 21.9% of them had osteoporosis, whereas in women aged 80 or above, the proportion increased to 44.3%.1 Apart from older age and lower BMI, participants could recognise fragility fracture (p=0.009) and diagnosis of osteoporosis (p=0.004) as risk factors for fracture. However, our multivariate logistic regression model showed that fragility fracture and diagnosis of osteoporosis were not statistically significantly associated with the underestimation of fracture risk. Osteoporosis preventive behavioursMost participants did not engage in osteoporosis preventive practices. A large proportion of them did not take calcium or vitamin D supplements. A majority of women aged older than 65 had not undergone a prior DXA scan, despite the recommendation of universal screening. A similar finding was observed from a local survey study conducted from December 2015 to January 2016, of 573 women aged 45 to 60, 65% of the respondents had never had a bone density scan.26 Apart from older age, many participants with a history of fragility fracture had not undergone DXA scanning. Our study demonstrated that women who correctly estimated or overestimated their fracture risk were more likely to have DXA scanning (p=0.036) and daily use of calcium supplements (p=0.028) (Table 1). The study by Barcenilla-Wong et al. also showed that individuals with heightened self-perceived risk of fracture had a higher likelihood of having DXA scanning.8 These findings align with what the health belief model proposed, by which improving the risk perception could result in better health behaviours.7 Therefore, enhancing the awareness of fracture risk among at-risk individuals could result in better compliance with osteoporosis preventive behaviours. Delivering health information was shown to be one of the factors which could enhance fracture risk awareness. The study by Langer et al. demonstrated that individuals who had received information about osteoporosis tended to have higher perceived fracture risk.12 One key implication of the current study is that at-risk individuals should be informed of their fracture risk and provided with relevant information about osteoporosis prevention. With a low rate of participation in DXA scan screening observed in our study, there may be an underdiagnosis of osteoporosis among the participants. We found that the proportion of women with osteoporosis was 9% among the total participants and 13.9% in those aged 65 or above (Table 3). This was relatively low compared to the prevalence of osteoporosis from previous local studies. In the study by Lo SS et al., with all participants (mean age of 69.4 ± 4.2) receiving DXA scanning, they found that 23.7% of them had osteoporosis.1 Similarly, another study from 2008 to 2011, involved 6,099 women aged 50 to 89 years old (mean age of 69.7 ± 6.0), with all of them receiving DXA scanning, 24.9% of the total participants had osteoporosis.27 We used Z-test to evaluate the difference in the proportion of osteoporosis between our study (9%) and the reported population (24.9%). The result of the Z-test was -6.90 (p<0.001), indicating a statistically significant difference between the observed and the population proportion of osteoporosis. The low rate of DXA scanning participation was one of the reasons for this marked difference in the proportion of osteoporosis. The current screening strategies implemented in primary care should be revised to improve the screening rate. Implications for practiceOur study showed that there was misalignment of self-perceived and calculated fracture risk among at-risk individuals, especially those who were older and with lower BMI. Health education should target at-risk individuals and include risk communications to increase their awareness of fracture risk and its possible consequences. Identifying and correcting any misperception could lead to better adherence to screening and bone-protective behaviours. FRAX is a useful tool for risk communication in health education. It is convenient to use and of low cost. The online FRAX calculator could be easily accessed by doctors. Primary care physicians could consider using FRAX to identify those with high fracture risk and help patients to better appreciate their fracture risk. For women aged above 65, as universal screening is recommended, FRAX is mainly used for identifying treatment groups in this age group. Whereas for women between 50 to 65 years old, doctors could use FRAX to identify individuals who need DXA scanning. Women with moderate or high FRAX risk should be referred for early DXA scanning, according to the guideline from Taiwan.22 Moreover, FRAX was effective in promoting DXA scan screening. In a two arm randomised controlled trial in the United Kingdom, for women in the screening group, those with the high calculated 10-year hip fracture risk were informed of their results. They were then recommended to have DXA scan screening and receive treatment. After 5 years, there was a 28% reduction in hip fractures observed.28 In addition, a scoping review demonstrated that using screening tools like FRAX could have a positive influence on women’s perspectives of osteoporosis prevention and could potentially reduce hip fracture risk and become cost-effective.29 Key messages
Future research directionsOverall, a higher quality prospective cohort study will be required to see if a higher perceived fracture risk leads to better health behaviours and a reduction in fragility fractures. If similar studies could be conducted in different districts in Hong Kong, the data would be more representative of the general population and could enhance the current osteoporosis screening policy. This study identified that most at-risk individuals did not have DXA scans. Apart from assessing their perceived fracture risk, future studies could also consider assessing the awareness and potential barriers to the universal osteoporosis screening program among at-risk groups. LimitationsWe used convenience sampling to recruit subjects and this could lead to sampling bias. Participants recruited from FMCs were likely to have comorbidities and have higher fracture risk than the general public. Self-perceived fracture risk was recognised as a subjective concept, and it could be influenced by the social background of the participants. Therefore, socioeconomic status and educational levels were possible confounding variables in our study.9 Most of the participants in our study were from a low socioeconomic background. Therefore, the findings from this study cannot be representative of the general public. In addition, the self-reported information from participants could introduce recall bias. As there was no funding available for DXA scanning in this study, we could not confirm the actual proportion of osteoporosis in the participants. Individuals with high calculated fracture risk may not have osteoporosis after confirmation from DXA scanning. Furthermore, there are several factors that may influence the accuracy of the fracture risk assessment derived from the FRAX algorithm. Firstly, the FRAX result may underestimate the actual risk as it does not account for a history of falls, multiple fractures, or asymptomatic vertebral fractures. Secondly, type 2 DM is a known risk factor for osteoporotic fracture, and the FRAX calculation may require modification for diabetic patients. Strategies such as selecting rheumatoid arthritis as an equivalent variable for DM or adding 10 years of age have been recommended.30 As details of participants’ comorbidities were not collected, the study was unable to identify participants with type 2 DM and modify their FRAX calculation. StrengthTo our knowledge, this was the first study to assess the fracture risk perception of postmenopausal women in Hong Kong. Our study provided valuable data on postmenopausal women from primary care settings. Instead of distributing questionnaires and asking the subjects to complete them, the principal investigator interviewed all participants individually to obtain information for the questionnaires. This ensured that all the questions from the questionnaire were properly answered. After the interview, all participants were informed of their 10-year major osteoporotic fracture risk derived from the FRAX algorithm. At risk individuals were advised to have a DXA scan for osteoporosis screening. For those participants who were keen to have the DXA scans, a referral letter to a private diagnostic centre was given. ConclusionWomen with high calculated fracture risk tend to underestimate their risk, particularly those with higher age and lower BMI. Most at-risk individuals never had a DXA scan. Appendix 2: Hong Kong Online FRAX tool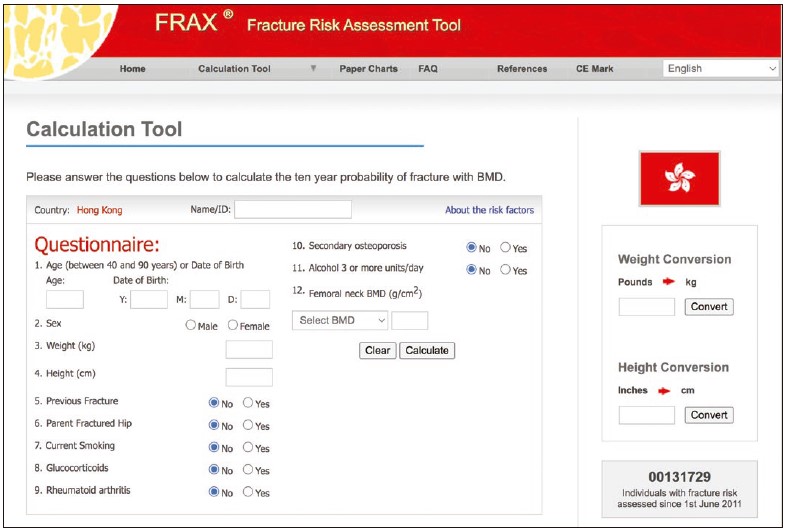
Reference: World Health Organization Collaborating Centre for Metabolic Bone Diseases, University of Shef-field. Fracture Risk Assessment tool (Hong Kong). [Internet]. The United Kingdom: Centre for Metabolic Bone Diseases; c2020 [updated September 2020; cited 2023 December 10]. Available from: https://frax.shef.ac.uk/FRAX/tool.aspx?country=20 References
Esther SC Pang,
MBBS, FRACGP, FHKCFP, FHKAM (Family Medicine)
Hua-li Wang,
LMCHK, FHKCFP, FRACGP, FHKAM (Family Medicine)
Wai-kit Ko,
MBBS (HKU), FHKCFP, FRACGP, FHKAM (Family Medicine)
Siu-kei Kwong,
MBBS (HKU), FHKCFP, FRACGP, FHKAM (Family Medicine)
Correspondence to: Dr. Esther SC Pang, 10 Aberdeen Reservoir Road, Aberdeen. | |||||||||||||||||||||||||||||||||||||||||||||||||||||||||||||||||||||||||||||||||||||||||||||||||||||||||||||||||||||||||||||||||||||||||||||||||||||||||||||||||||||||||||||||||||||||||||||||||||||||||||||||||||||||||||||||||||||||||||||||||||||||||||||||||||||||||||||||||||||||||||||||||||||||||||||||